Most of the post-Presidential primary analysis has focused on how wrong the pundits were when it came to Donald Trump winning and Bernie Sanders' staying power. While these are true and important observations, there has sadly been little discussion about what we can learn about the two inevitable nominees from the data in the primaries. Clearly, focus has moved on to the general election, along with the accepted narrative that Republican voters have come to accept the Trump nomination while Clinton has still yet to win over many Sanders supporters. But is this analysis based on actual data or does it just sound good and so it get repeated? On the surface, these narratives are somewhat true, but as is always the case there is a lot more to the story than a few topline numbers in public polls.
Starting with Trump, if you look back at the coverage, most pundits were insisting that Donald Trump was at his ceiling in January, and that he had no room for growth. Clearly this was not that case, but much of the focus recently has been on the fact that it wasn't until New York that Trump won a majority level of support. While the pure number of candidates had a lot to do with this, our data shows that Trump's inevitable path to a majority level of support can be traced back to late 2015.
Since last fall, through our Trendency Research platform, we have been tracking the thoughts and opinions of likely voters in 10 swing states. Our analysis of data compiled from 8 months of research shows that the idea of a Trump ceiling was never correct. Instead it was a product of an oversimplified view of voters and of the data.
Just as a bit of background, Trendency Research is an online survey platform that breaks the mold of traditional polling. In our research, we don't ask for binary responses to questions (are you a Trump voter or not). Instead, we allow users to allocate their choice of candidates on a sliding scale. They can apportion all their support to one person, or divide it among several if they haven't made up their mind. Voters log-in to take our surveys on a regular basis over the course of several months and the site registers the changes (or lack thereof) in their opinions on each visit.
In the analysis, Trendency algorithms utilize what we term as Threshold Analysis to separate strong and consistent supporters from weak or more volatile voters. Voters at higher Thresholds display less volatility and are more likely to continue their current behavior or support their preferred candidate. As you move to lower Thresholds, voters begin to show more volatility in their choices and the support they would technically register in traditional polling methods is not necessarily predictive of their most likely final outcome.
In the end, this allows for a more complete view of the horserace than simple topline results. For example, a voter logging into Trendency may give Clinton 100 percent support one week and then only 75 percent support the next. Under the conditions of a standard survey, this voter would still say they were voting for Hillary, even though the strength of their support has dipped. Trendency reads this movement and inputs it into the Threshold Analysis, while traditional polling methods would not detect this shift.
Looking back, we decided to examine the Presidential primaries at the Average Threshold across eight of the swing states we are tracking (we did not track the primaries in the two caucus states of Nevada and Colorado), to see what the numbers show. Over the past eight months, Donald Trump's support among Republican primary voters remained low at first, but continued to tick upwards starting in November of 2015 and then accelerated quickly in January. Throughout the fall and early primaries and caucuses, experts watching the race kept predicting that Trump would hit his ceiling, particularly as more candidates dropped out of the race and the Republican establishment coalesced around one candidate. However, that was never the case.
As Trendency's data shows (see Figure 1), Trump continued to grow his Average Threshold support, particularly once other candidates started dropping out. Regardless of which candidate left the race, whether they were considered an outsider or establishment favorite, Trump benefitted from each.
Figure 1: Average Threshold Analysis over time
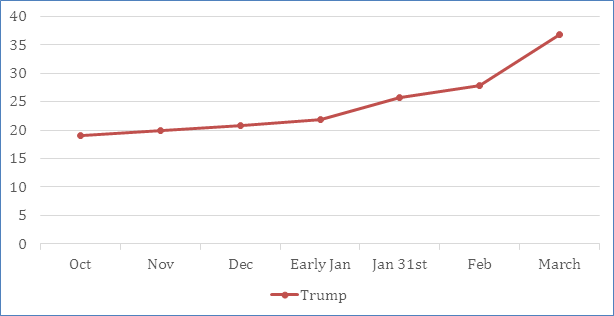
From October to early January, Trump's Average Threshold was slowly rising each month (about a point each 30-day period). However, following the official start of the primary elections, Trump continued to pick up speed, hitting his stride among the Republican primary electorate in January where his Average Threshold support jumped five points. As the trend line above shows, Trump then continued to build that support through the beginning of the early primaries and was off to the races once March rolled around.
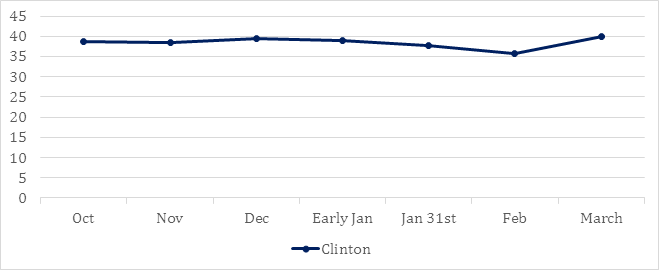
On the Democratic side, Hillary Clinton's support was about as steady as it comes. Last October, her Average Threshold was just under 39 and she held steady until the end of January when her average dipped just slightly to 38 and then down to 36 by mid-February. As Figure 2 shows, 30 days later her support was back up to 40. Said in another way, over a six-month period her Average Threshold moved only within a two-point range. Despite the increase in attention and enthusiasm directed towards Senator Sanders, Clinton had a reliable base of support in these eight swing states that remained unwavering throughout the primary. At the same time, that base of support did not grow larger regardless of the millions of dollars her campaign and supporting groups spent.
Figure 2: Average Threshold Analysis over time
Looking back, there are two clear takeaways from this data: 1) Donald Trump's support has been growing since late 2015 and he had a clear ability to attract Republican primary voters to his campaign regardless of which candidate they were previously supporting; and 2) Hillary Clinton's support was unwavering, and her campaign did little to change the views Democratic primary held of her, although given her strong starting position that was all she needed to do.
As we all know, the voters who vote in these primaries are vastly different than those that will vote this November. However we fully expect the poor analysis to continue from the chattering class. A non-binary view of voters opens up a new set of measurements that will allow us to get a better feel for what is going to happen on Election Day. It also allows us to look backwards and look past wins and losses and see who was doing a good job of increasing their odds of success and who was not. In an earlier piece, we explained what it will take for Donald Trump to win the presidency, and we will be keeping a close eye on these benchmarks. In addition we are keeping a close eye on how steady Clinton's support remains, and if she is able to increase her overall Threshold Average, and if Trump can continue to increase his average or if March was the end of his upward trajectory.