The whispers on Wall Street lately have been the feared "double-dip." There is a much louder chorus of people proclaiming that we are only looking at a "slow-down." Of course they were the same people who were telling us as recently as April that we were in a "V-shaped" recovery.
Generally speaking, Liz Ann Sonders agrees.
"I'm amazed people still say it's not a 'V'-shaped recovery, which to means they're simply not looking at the charts," says Charles Schwab's chief investment strategist.
Ah, yes. The charts. I have several issues with people who say things like this.
The first issue is that these chart worshipers never look at all the charts, and concerning the ones they do look at, they usually tend to rationalize what the charts are saying to fit their bias.
A good example of this would be the people who couldn't see the housing bust coming until it was happening. They never looked at household debt levels, credit conditions, and most of all, historic housing prices related to income and rent. They only looked at home prices and default levels, both of which never revealed a problem...until there was a very big problem.
The second issue I have is the historic record of these chart worshipers. Most of these people would have gotten fired as TV weathermen for gross incompetence by consistently being wrong. Yet they show no shame or guilt. They don't even seem to be able to recall their failures.
Part-swappers versus diagnosticians
I believe the problem is that economists today are the equivalent of "part-swappers." By this term I am comparing economists to most auto mechanics.
The average auto mechanic is a "part-swapper." He looks around your engine to find out what part isn't running correctly, then he changes it out. If that doesn't work, then he swaps out another part, and another, until he eventually takes care of the problem. The part-swapper only needs to know the basics of how a car runs. As long as the problem is simple, he usually fixes it.
The diagnostician, on the other hand, is a much more rare breed. He's a master at his craft. He understand how the various parts of the car work together. Unlike the part-swapper, the diagnostician never answers, "I'm not certain" when asked why something failed. When the diagnostician starts telling you what he knows you need to shut up and listen, because what he says will save you money down the road.
You can also see this separation in the IT support field. The part-swappers tend to work on Microsoft Windows. The diagnosticians prefer Linux, tolerate Macintosh, and have nothing but disdain for Windows. The reason is because Windows never lets you do more than swap parts. You can never be certain how the various parts work together.
Which brings us back to economics. Looking at a couple charts doesn't tell you everything you need to know. In fact, sometimes even the raw numbers need to be interpreted. That's where the part-swappers and diagnosticians get separated.
Not all jobs are equal
A good example of this is the recent employment report.
Nonfarm payrolls fell by 125,000 during the month of June, but the Labor Department stressed that the drop reflects a 225,000 decrease in the number of temporary census workers. Meanwhile, the private-sector added 83,000 jobs, better than the 33,000 it added in May, which was revised lower from 41,000. The unemployment rate also fell to 9.5%, from 9.7%, lower than the 9.8% anticipated by Wall Street, even though concerns remain that the figure could rise back to 10% before the recovery is complete.
This article is pretty typical of the financial news coverage, except that they took the extra step to report that last month's numbers were revised down. It was a positive report overall.
So what is wrong here?
Quite simply, a complete lack of asking, much less answering, the obvious questions. For instance, how could the unemployment rate drop while we are losing 125,000 jobs?
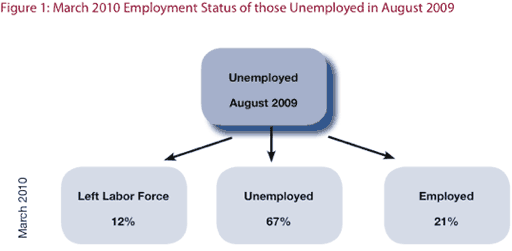
The reason is because 652,000 people were dropped from the labor force. A full 842,000 were added to the rolls of "not in labor force." People were dropped from the labor force faster than we lost jobs last month. If you simply stop counting people then your numbers can improve a great deal. We could arrive at "full-employment" in no time at this rate.
What's more, the numbers themselves are rather funky. Consider the Birth/Death Model, in which the BLS plugs in "assumed" jobs from new businesses that can't be verified. Consider where the economy is supposedly growing:
The B/D adjustments say that we added 65,000 construction jobs in the last two months, over half the total number of jobs created. Really? US single-family homes set an all-time low sales number this week. Mortgage applications are way down. Home construction is off. Commercial real estate construction is down. Where are those construction jobs?
For the blogs this is usually where the analysis ends. I wanted to take this a step further. I noticed that the non-seasonally adjusted numbers didn't look nearly as bad as the seasonally-adjusted numbers did. The labor force and participation rate both went up. So why does the seasonally-adjusted numbers show such a large decline?
Part of the reason is because June is normally the month that nearly a million teens join the workforce for the summer. Not this time. Less than 500,000 teens found jobs in June, the lowest number since 1951. As a result, 152,000 teens were dropped from the workforce. Another 120,000 college-aged kids between 20 and 24 years old were also dropped from the workforce.
There are two things to take away from these numbers.
The first thing is that the Birth/Death model says 158,000 new jobs have supposedly been created in the hospitality and leisure industry in the last two months, the areas where so many of these kids normally get summer jobs. Considering the June jobs report and the state of the Gulf coast beach resorts, I get the feeling that the Birth/Death model jobs will be revised much lower in the future.
The second thing to consider is the current condition of the long-term unemployed. The average duration of unemployment is now 35.2 weeks, a record. Nearly half of those laid off will exhaust their standard state unemployment benefits before they find a job.
But the key information here concerns the older unemployed worker.
The unemployment rate for over-55s is at the highest level since 1948. Since the recession started, both the number of older people seeking work and the rate of unemployment for over-55s have increased more sharply than for all other demographic groups. And older workers comprise a high share of the long-term unemployed. In May, the average duration of unemployment for older job-seekers climbed to 44.2 weeks, 11 more weeks than the national average. Nearly six in ten older job-seekers have been out of work for more than six months.
The reason why this is significant is what happened to the unemployment extensions in June. The Senate blocked an extension of them.
So what do you think all those older unemployed workers did in June when their unemployment checks stopped? I don't have any proof, and there won't be any hard evidence of it for several months, but I can make a pretty good guess. There is a reason why those teenagers couldn't get those temporary, part-time, minimum-wage jobs last month. The jobs had already been filled by people a lot older than them.
Jobs, class and chart worshipers
The economic "part-swappers" will never look that deep into the numbers to ever come to that conclusion. Nor will they even care because every job only counts as one job to them. They don't care that the temporary, part-time, minimum-wage jobs make a fraction of the wage that the job previously held made because they don't really understand what it means to the economy in general. What matters to them is that the jobs chart went "up." Or, in this case, it went down a little less.
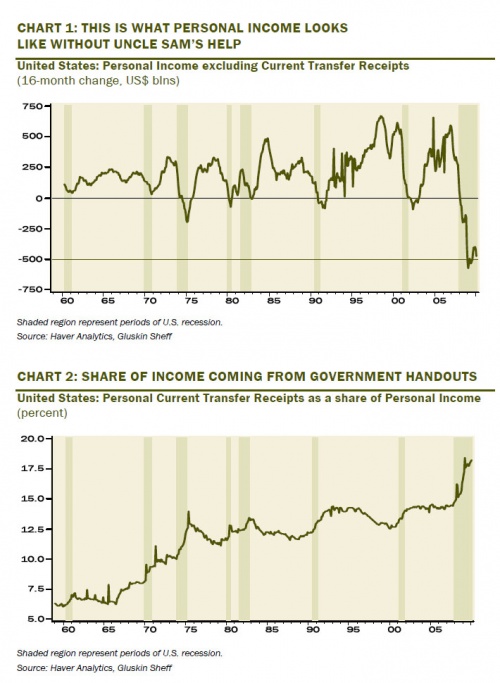
The chart worshipers will look to personal income to see if there is a change to the economy. As long as it goes up, no problem. The personal income chart gives nothing but a summary number. It fails to show such things as the rich becoming more wealthy at the expense of the poor.
Which brings up my biggest problem with economists today - ignoring the issue of class.
One of the primary reasons that the field of economics has so completely failed as a science is that it ignores the subject of how wealth is distributed. Instead economists treat every consumer as if their interests were exactly the same.
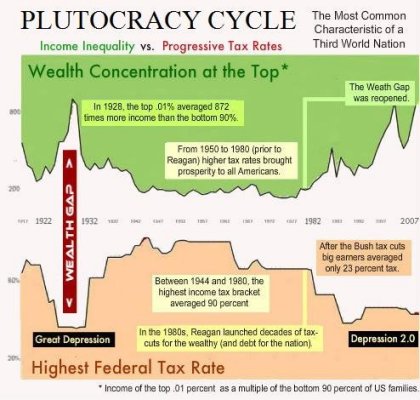
That is, if we picture an auditorium with one hundred people and one hundred seats, the single richest person would be able to spread out smartly over nearly forty-three seats. The poorest sixty people in the auditorium would have to make due squeezing into a single seat.
This mal-distribution of wealth does not bode well for a society based on the buying and selling of goods. Our super-rich plutocrats, after all, do not need more than five or ten automobiles or five or ten homes each. This top one percent--3 million people--certainly cannot purchase all the goods that the poorest 180 million Americans would be capable of purchasing had our society a more equal distribution of wealth.
One of the few economists in the world today that I respect is Steve Keen. In his seminal book Debunking Economics he breaks down the various assumptions that the field of economics is built upon that, to put it simply, are bald-faced lies. One of those assumptions is the behavior of consumers and income.
Classical economists such as Smith, Ricardo, and Marx divided society into social classes, and considered how different policies might favour one social class over another. The notion of class has been expunged from economics by the concept of the indifference curve and its 'one size fits all' treatment of everyone from the poorest Bedouin to the richest American. Yet because the preferences of different individuals cannot be meaningfully aggregated, this concept is invalid for the analysis of anything more than an isolated individual.
But the conditions under which aggregation is valid - when tastes are identical and unaffected by changes in income - are at least reasonable as first approximations when the analysis splits society into different social classes. It is not too unreasonable to lump all workers, all landlords, and all capitalists together, as Smith, Ricardo and Marx used to do. Incomes within a class vary substantially less than incomes between classes, and tastes are far more likely to be common within classes than between them.
This is more than just an academic exercise.
If the personal income chart remains flat, economists will expect demand to remain the same. However, if that personal income is being concentrated in just a few hands then in reality demand is going to fall, because the wealthy don't need to consume with nearly as much of their income as the poor do.
To give you a different example, this is why the whole concept of Trickle-Down Economics was always a joke. Anyone who wasn't a chart worshiping, part-swapper could see that.
What this means is that our fiscal and monetary policies of the last 30 years that heavily favor the wealthy and their wealth concentration will increasingly cause economic difficulty because consumer demand will forever fall short of expectations (now that the credit bubble has burst). The top 1% will simply not consume at the same percentage of personal income as the working class, while they increasingly absorb more of aggregate income.
With consumer demand not bouncing back as expected, economic growth will underperform and double-dip recessions will become more likely.
It would be a miraculous revelation if the general field of economics would accept this basic, logical concept. They won't because their wealthy masters don't want people talking about class and having rational, informed discussions about who really benefits from today's fiscal and monetary policies.
But if the field of economics ever wanted to regain its credibility, it must start discussing the issue of class.
Instability, class and part-swappers
This is all good stuff, but like the unemployment numbers, I wanted to keep digging. While economists like Steve Keen and Michael Hudson draw attention to the issue of class and consumer demand, I can't help but wonder about the other side of the same coin: class and capital.
As the world's wealth becomes increasingly concentrated in fewer hands, less of it is consumed and more of it is saved. Well, the wealthy have to do something with all that money. How does that effect the world economy?
To answer that, let's compare the world economy before Reaganomics to after.
From the late 1940's to 1982, regional and global financial crisis, as well as domestic banking crisis, were very rare. Since 1982, and increasingly so over the last 15 years, there are more, larger, and more frequent financial crisis.
The U.N. is blaming the root of this instability on the dollar-based monetary system, and their charge is not without merit. Their solution? Ditching the dollar and going to a system based on IMF Special Drawing Rights (SDR's).
SDR's are nothing but a notation on a ledger based on Yen, Pounds, Dollars, and Euros. Thus the U.N. surprisingly identified a critical flaw in the world economic system, and in the same instant revealed that they are nothing but part-swappers.
I propose that the problem is instead more and more capital in idle hands seeking quick returns on investment.
No one talked about hedge funds a few decades ago. That's because they barely existed in 1980. Now they have over $2.7 Trillion in assets and are globally disruptive. Small nations literally fear them.
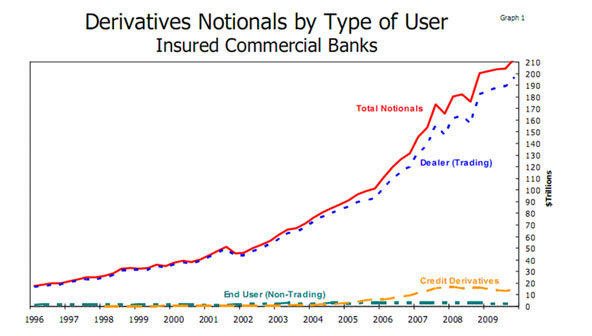
The same goes for the increase in forex trading, exotic debt instruments, and derivatives. These are not markets that the working class can play in. It's the domain of the wealthy, and as the wealthy continue to accumulate massive amounts of capital they need places to put it.
Just look at the world bond market today. It is enormous, about $67 Trillion, yet bond prices in many countries are still at historic highs. The wealthy are buying bonds by the truckload because they need some place to park their cash. They've never minded if the world's taxpayers are loaded down with debt, they are more than happy to buy it, just as long as the taxpayers continue to pay interest on said debt.
Bonds, stocks, real estate, crude oil, everything is already expensive in historic terms.
As the amount of wealth grows larger and into fewer hands it also increasingly becomes a more destabilizing force on the world financial system. It rushes from one country or sector to another, frantically trying to beat the crowd and avoid losses. The rapid influx and outflow makes it increasingly difficult for normal market operations in the real economy. How can the market accurately price an asset when it could double in price, or drop to half price at any moment, for reasons other than supply and demand?
It is also a destabilizing effect for democracies, as these self-interested financial entities grab increasing amounts of political power.
Basically what I am saying is that the increasing global wealth inequality is amplifying capitalism's built-in instability that Hyman Minsky so eloquently explained in his book Stabilizing an Unstable Economy. Unless the trend is reversed these financial forces will cause the real economy to stop functioning, at least in a efficient way, and eventually break down the entire monetary system.