
Branko Milanovic is the lead economist of the World Bank's Research Department and Professor of Economics at Johns Hopkins University.
WASHINGTON -- The period between the fall of the Berlin Wall and the Great Recession saw the profoundest reshuffle of individual incomes on the global scale since the Industrial revolution. This was driven by high growth rates of the populous and formerly poor or very poor countries like China, Indonesia and India, and, on the other hand, by the stagnation or declines of incomes in Latin America and post-Communist countries as well as among poorer segments of the population in rich countries.
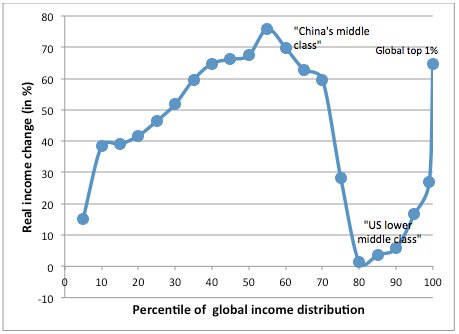
Figure 1. Real income change at various percentiles of global income distribution between 1988 and 2008 (in percent)
These results come from a detailed work on household survey data from about 120 countries over the period 1988-2008.
To analyze this data, each country's distribution has been divided into ten deciles (each decile is composed of 10% of people) according to their per capita disposable income (or consumption).
In order to make incomes fully comparable across countries and time, they are corrected both for domestic inflation and differences in price levels between the countries. It is then possible to observe not, as we usually do, how the position of different countries changes in time but also how the position of various deciles within every country changes.
For example, Japan's top decile remained at the 99th (2nd highest from the top) world percentile, but Japan's median decile dropped from the 91st to the 88th global percentile. Or to take another example: people belonging to the top Chinese urban decile moved from being in the position of the 68th global percentile in 1988 to being at the position of the 83rd global percentile in 2008, thus leapfrogging in the process some 15 percent of the world population or almost 1 billion people.
When we line up all individuals in the world, from the poorest to the richest (going from the left to right on the horizontal axis in figure 1 above), and display on the vertical axis the percentage increase in their real income over the period 1988-2008, we obtain an S shaped curve, indicating that the largest gains were realized by the people around the global median (50th percentile) and among the global top 1%.
People around the median almost doubled their real incomes. Not surprisingly, 9 out of 10 such "winners" were from the "resurgent Asia" (they are notionally labeled "China's middle class" in the figure). For example, a person around the middle of the Chinese urban income distribution saw his or her 1988 real income multiplied by a factor of almost 3; the one in the middle of the Indonesian or Thai income distributions by a factor of 2, Indian by a factor of 1.4 etc.
But after the global median, the gains rapidly decrease, becoming almost negligible around the 85th-90th global percentiles and then shooting up for the global top 1%. It is perhaps less expected that people who gained the least were almost entirely from the "mature economies", OECD members that include also a number of former Communist countries.
But even when we take the latter out, the overwhelming majority in that group of "losers" are from the "old, conventional" rich world (labeled notionally "US lower middle class" in figure). But not just anyone from the rich world. Rather, the "losers" were predominantly the people who in their countries belong to the lower halves of national income distributions. Those around the median of German income distribution have gained only 7% in real terms over 20 years; those in the United States 26%, those in Japan lost out in real terms.
The particular supine S-shaped "gain curve" does not allow us to immediate gauge whether global inequality might have gone up or down because the gains around the median (which are pro-equality) may be offset by the gains of the global top 1% (which are anti-equality). On balance however it turns out that the first elements dominates and that global inequality, as measured by most conventional indicators, went down during the past 20 years of globalization. Was it then all for the better?
Probably yes, but not so simply. The striking association of large gains around the median of the global income distribution, received mostly by the Asian populations, and the stagnation of incomes among the poor people or lower middle classes in rich countries, naturally opens the question whether the two are associated.
Does the growth of China and India take place on the back of the middle class in rich countries? There are many studies that, for particular types of workers, discuss the issue of substitutability between rich countries' low-skilled labor and the labor, embodied in traded goods and services or outsourcing, from the Asian countries. Global income data do not allow us to establish or reject the causality. But they are quite suggestive that the two phenomena may not be unrelated.
A dramatic way to see the change wrought by globalization is to compare the evolution over time of the 2nd US income decile with (say) Chinese urban 8th decile (figure 2). Indeed we are comparing relatively poor people in the US with relatively rich people in China but given the income differences between the two countries, and that the two groups may be thought to be in some kind of global competition, the comparison make sense.
Here we extend the analysis to 2011, using more recent and preliminary data. While the real income of the US 2nd decile has increased by some 20% in quarter century, the income of China's 8th decile has been multiplied by a factor of 6.5. The absolute income gap, still significant five years ago, before the onset of the Great recession, has almost been eliminated. Figure 2. Real per capita income of the 2nd income decile in the US and 8th urban income decile in China between 1988 and 2011.
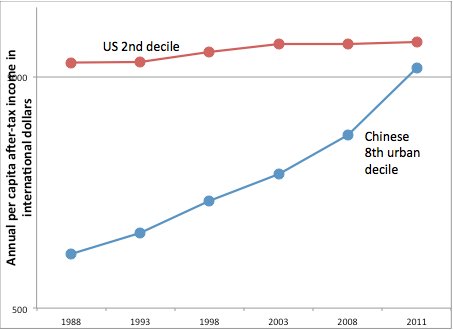
Note: vertical axis in logs.
And even if the causality cannot be established, the association between the two cannot pass unnoticed. What are then its implications?
First, if we see, metaphorically, the movement of the Chinese labor through the ranks of the global income distribution as a huge wave that like in our S supine graph creates the trough among the lower middle classes in "mature economies", it is likely that this wave will be followed by at least several additional waves coming either from the rest of China, or later from Indonesia, Nigeria, India etc. Does this imply that the developments that are profoundly positive from the global point of view, may prove to be destabilizing for individual rich countries?
Second, if we take a simplistic, but effective, view that democracy is correlated with large and vibrant middle class, the continued hollowing out of the middle class in the rich world would, combined with growth of incomes at the top, imply a movement away from democracy and toward forms of plutocracy. Could China, with its rising middle class, become more democratic and the United States, with is shrinking middle class, less?
Third, and probably the most difficult, what would such movements, if they continue for a couple of decades, imply for global stability? The formation of a global middle class, or the already perceptible "homogenization" of the global top 1%, regardless of the country where they come from, may be both deemed good for world stability and interdependency, and socially bad for individual countries as the rich get "delinked" from their co-citizens.
In a nutshell, the movements that we witness lead to an economic rebalancing of the East and West, where both may end up with their global output shares close to what they had before the Industrial revolution.
They also expose the contradiction between the current world order where political power is concentrated at the level of the nation-state but where the economic forces of globalization which have gone far beyond it.
1. "Percentile" indicates one's position in income distribution. The richest 1 percent of people ("the top 1%") are the 100th percentile, the poorest are the 1st percentile.