

According to new Census Bureau data released Wednesday, poverty rates as officially measured did not rise as expected last year and more people were covered by health insurance. Middle class incomes fell significantly, however, and inequality increased.
Basically, the message here is policy matters. Where policy addressed a market failure -- rising shares of the uninsured; poor families with low wages and nutritional needs -- the situation improved. Where we didn't apply policy measures to market failures -- the weak labor market on which middle-income, working families depend -- things got worse.
Health Insurance Coverage: As regards the improvement in health coverage, public policies associated with the Affordable Care Act helped to boost insurance rates of young adults.
From CBPP's statement:
The main positive news in today's report is the fall in the share of Americans who are uninsured, from 16.3 percent in 2010 to 15.7 percent in 2011, the largest annual improvement since 1999. That improvement was driven in part by gains in coverage among young adults, which appear largely due to a provision of the health reform law allowing them to remain on their parent's health plan until they reach age 26. Forty percent of the decline in the number of uninsured people came among individuals aged 19-25. Some 539,000 fewer 19-25-year-olds were uninsured in 2011 than in 2010.
Poverty: The extent to which the safety net helped the poor is complicated by the fact that some of their most important benefits are not counted as income in the official poverty rate, which was essentially unchanged last year, falling from 15.1 percent to 15 percent. But as my colleague Arloc Sherman points out, these benefits actually lifted millions of households above the poverty thresholds:
The official poverty figures count only cash income, so they don't reflect the antipoverty impact of some key safety net programs, such as the Earned Income Tax Credit (EITC) and SNAP (formerly food stamps). But the Census data released this morning show that if you count these benefits, the EITC lifted 5.7 million people -- including 3 million children -- out of poverty in 2011, and SNAP lifted out 3.9 million people, including 1.7 million children.
Income: So what happened to middle incomes last year?
Median household income, adjusted for inflation (as are all the figures I'll cite here), fell by 1.5 percent in 2011, a loss of about $780 in 2011 dollars. This is a continuation of a pattern that began with the deep recession that began in 2007. In fact, since then, median household income is down 8 percent, or about $4,400.
Moreover, remember that incomes in the middle of the scale were flat over the 2000s business cycle, well before the recession took hold. In other words, for far too many in the middle class, income trends have devolved from stagnation to decline.
This is largely a labor market story and an inequality story. The economy expanded last year -- GDP was up 1.8 percent -- not a huge growth rate, but that's $270 billion in new output, none of which found its way to the middle class.
Other data from today's Census release further support this job market story. The median income of working age households, omitting retirees who depend less on labor market earnings, fell 2.4 percent last year, down $1,400 and down 9 percent -- $5,700 -- since 2007 (see figure). In fact, the level of median income for these working age households -- about $55,600 -- is about the same income level this household type had -- again, in today's dollars -- in 1993, giving back all of the gains accrued in the 1990s. Meanwhile, productivity is up 50 percent since 1993.
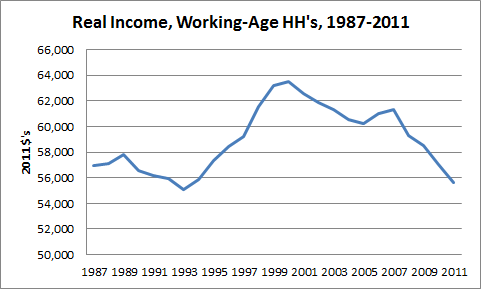 Source: Census
So where is the growth going?
Though Census data are incomplete on this point -- they include neither the capital gains that flow largely to the top of the income scale nor, as mentioned, the near cash benefits at the bottom, they still provide useful information on income inequality.
For example, the shares of the nation's income going to each of the bottom three-fifths of households were the lowest on record last year, in data that go back to 1967, while the share of income going to the top fifth was the highest on record (see figure).
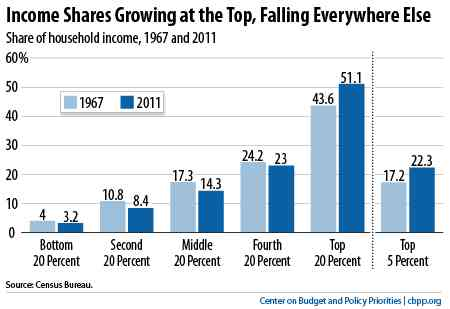
The bottom 20 percent of households received just 3.2 percent of all household income in 2011, and the middle fifth of households received only 14.3 percent of the income. But the top 20 percent of households got 51.1 percent of the income in the nation, and the top 5 percent of households garnered 22.3 percent.
In short, as more of the gains of economic growth have accumulated at the top, the shares of the national income going to the bottom and middle have fallen.
It's a stark reminder that when it comes to the living standards of middle- and low-income families, overall economic growth is necessary but not sufficient. For these families to get ahead, the economy must not only expand but that expansion must reach more households, particularly those for whom growth has been largely a spectator sport.
Policy Matters: A year ago, President Obama introduced the American Jobs Act. It included fiscal relief to help states stave off these very sorts of layoffs, as well as infrastructure investments like FAST!
The fact that Congress was unwilling to approve these jobs measures is one reason middle class families continue to struggle and why the growth that we are generating is doing an end run around them. In fact, if you think back to 2011, instead of debating jobs measures that could have helped middle class and low-income workers, what was Congress fighting about? Whether or not to default on the national debt. And now there's the specter of the fiscal cliff, another potential self-inflicted wound to an economy that needs a shot in the arm not a punch in the head.
These results carry two lessons. First, they pose yet another reminder to policy makers that austerity measures in an economy that remains well below potential with a job market that's still far too slack are exactly the wrong way to go. Second, they show that the economic problems we face are, in fact, amenable to policy intervention.
I'm, of course, not suggesting that the anti-poverty measures noted above are solving the market failure of poverty, nor are the few pieces of the ACA that are in place solving the challenge of health coverage. But they're both helping, and if policy makers were listening to these data, they'd recognize that such measures point the way forward.
Update: If you happened to note some different numbers on the income shares in the WaPo article on these data Wednesday, that's because the Census publishes two versions of this time series: the one that I cited above, and one in which households are adjusted for changes in family size. The historical results are the same except in the size-adjusted series, the share of income going to the lowest fifth is tied for the lowest on record.