
I recently pointed out that contrary to conservative claims that the food stamp, or SNAP, program has run amok, participation is high for a reason: there are still a lot of folks struggling to provide their families with adequate nutrition, and this program has been particularly responsive to that need. This is what we call: a good thing, not a bad thing. As I wrote then:
SNAP rolls increased sharply in the recession, as you'd expect -- along with UI, SNAP was and is highly elastic to increased need -- [and] they've decelerated of late as the economy has slowly improved, though here again, it's not improved as fast for those more exposed to food insecurity.
But did they increase more than they "should have" over the past few years? One simple way to answer that question is to build a statistical model of SNAP caseloads as a function of the economy, estimate the model through 2007, and then project caseloads over the next few years based on actual economic outcomes. Then compare your forecast to the actual path of food stamp rolls. If the conservatives are right (and you've got a solid model), then your prediction should be well below the actual caseload path.
Fortunately, that's one of the things that Ganong and Liebman do in this new paper (I borrowed their figure below). They predict the post-07 increase in the rolls based on the change in unemployment and find that their predicted caseloads pretty closely match what actually happened (the weighted estimate provides a particularly tight fit and it is the right one to use when forecasting the national caseload*).
Their model goes through 2011, but I've got a similar one almost ready with a colleague that goes through 2012 and we're finding the same thing. SNAP caseloads went up (and their increase is now slowing) because they needed to go up in order to offset some pretty pernicious impacts of the recession and its aftermath. This research shows -- clearly, I think -- that had they not gone up, something would have been very wrong.
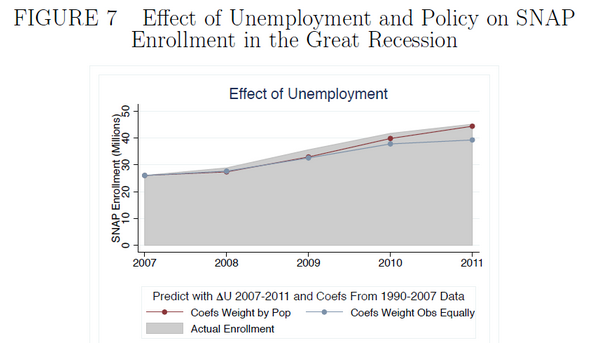
Source: Ganong and Liebman, 2013
*My answer to the question of whether one should use weighted or unweighted estimates in panel data like this (they use county level data starting in 1990) is that it depends of what you're investigating. If you're asking how different state policies affect certain outcomes, like how different minimum wage laws effect employment, then don't weight. Treat each state as its own, equally weighted experiment. But if you're trying to figure out what drives a national trend, like the one in Figure 7, weight the areas proportionately as per their influence on that trend (i.e., use population weights).
This post originally appeared at Jared Bernstein's On The Economy blog.