Anyone who had the misfortune to hear the Sunday talk shows knows that the Republicans have decided to use their claims that spending is not consumption, that that it does not create or preserve jobs, and to point -- as the Minority Leader McConnell did -- to the New Deal as being a failure.
Way back in October, when the so-called "pundits" were suggesting there may be a need for another ~$150 billion stimulus, the case was made on these pages for massive public investment as the only source of consumption in a contracting economy, and cited the New Deal. ("Wanted: A Good Keynesian. Massive Public Investment Will Fix the Economy" October 13, 2008). This became the basis for the stimulus plan, until it was partially emasculated by Republicans.
Instead of wasting words on those who will not hear, switch senses to sight, show them this graph, and ask them to explain it:
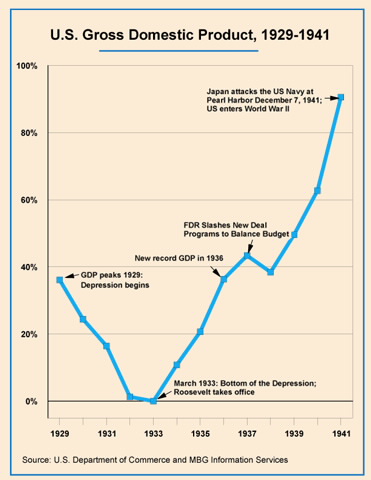
(The Y-Axis is GDP expressed as a percentage increase over the lowest GDP in 1933. Note that in 1929, the GDP is nearly 40% ABOVE the 1933 low, and this was surpassed in 1936)
As pointed out in the above-referenced article, the key observation in this graph is the downturn in 1936-37. This is as close to a "scientific experiment" as there can be in macroeconomics: from '33 to '36 Roosevelt unleashed the New Deal and what passed at the time as massive spending. The GDP grew every year by double-digits.
Then, in a reversion to his true roots as a fiscal conservative, FDR decided that it was time to slash spending to balance the budget. The economy contracted. Then in '38, realizing the error of his ways, Roosevelt started spending again, and GDP grew every year thereafter.
Note the sequence: spending, tightening, spending. Growth-contraction-growth. These conditions mirror the requirements in medicine to prove disease causation that are known as Koch's Postulates: discover the causative agent and remove it; demonstrate the disease is effectively treated; then introduce the causative agent again and show it causes the disease. Without that last step, the first correlation may be coincidence and not cause. [For those interested in a medical example of Koch's Postulates, see below ]*.
With the Great Depression, there was the '29 Crash and contracting government spending, with the "disease" of severe economic contraction; then, in 1933 the ballooning of government spending and economic growth; then in 1936 the reduction of government spending and economic contraction; and then, in 1938 increased government spending and a return to economic growth.
It is interesting to note that Republicans, who have delighted for 50 years in attributing the end of the Great Depression to World War II, conveniently omit that in World War II there were wage-price control boards, rationing, higher taxes and massive government spending. Other than massive government spending, and "employment" in the armed forces, there is nothing economically "magic" about war. One might even suggest that, from a pure economics perspective, much of the spending in war is wasteful, building machines that will be destroyed before their useful life is completed.
But, these are all words. Just show opponents the graph, and ask them to explain how it was that the GDP in 1936 exceeded that in 1929 and never, even with the 1937 contraction, fell below that level again. And why, if government spending were irrelevant or even counterproductive, GDP fell when government spending was reduced and then grew again when it was again increased?
Because of the unplanned "experiment" of 1937, there is more compelling data showing the causative link between massive government spending and economic growth in the setting of a major economic contraction than there is for taxcuts: remember, George HW Bush and Bill Clinton raised taxes, and the 1990s were a period of sustained economic growth. And, the Bush tax cuts--the weakest recovery in history.
In 3-4 years the New Deal returned GDP to pre-Depression levels. It never sank below that again.
Some failure!
* E.g., for those interested how Koch's Postulates work, to prove a person has gluten "allergy" causing malabsorption, a biopsy is taken of the duodenum demonstrating abnormalities; then gluten is withdrawn from the diet, the malabsorption improves, and a repeat biopsy shows a normal duodenum; then, gluten is added back, the symptoms return and a biopsy looks like the first one. This patient has "celiac disease" caused by gluten, and his treatment is a gluten-free diet].